Global Ranking 1 of 4. World Economic Freedom as of 2019
This page primarily focuses on the Heritage Foundation's 25th edition of its Index of Economic Freedom—albeit a total of four global rankings are reviewed. This page imparts a general overview of the contemporary state of the global business sector.
In scoring the Heritage Foundation's 2019 Index of Economic Freedom, the overall degree of economic freedom was based on the following 12 performance measures:
- property rights
- judicial effectiveness
- government integrity
- tax burden
- government spending
- fiscal health
- business freedom
- labor freedom
- monetary freedom
- trade freedom
- investment freedom
- financial freedom
For 2019's 25th edition of the economic freedom index, Hong Kong was ranked as number one. Hong Kong was deemed as the country with the highest score on the overall economic freedom barometer. The graphics below provide a visual synopsis of the economic freedom index. To summarize the 2019 Index of Economic Freedom, the following observations were noted:
| Summary |
Score |
Country |
| Highest Score |
90.2 |
Hong Kong |
| Lowest Score |
5.9 |
North Korea |
| Average or Mean Score |
60.76833333 |
Saudi Arabia and Kuwait |
| Middle or Median Score |
60.75 |
Saudi Arabia and Kuwait |
| Most Frequent or Mode Score |
55.4 |
Belize, Comoros, Mongolia, and Tunisia |
| Total Countries Surveyed |
180 |
See table below |
If an imaginary line was drawn down the middle of the index, then all countries scoring above 60.76833333 would be considered as above average performers on overall economic freedom. All countries scoring below 60.76833333 would be deemed as below average performers on overall economic freedom as of 2019.
By region, of the countries surveyed, the top performing countries in each region were the following:
| Country |
Score |
Rank |
Region |
| Canada |
77.7 |
8 |
Americas |
| Hong Kong |
90.2 |
1 |
Asia-Pacific |
| Switzerland |
81.9 |
4 |
Europe |
| United Arab Emirates |
77.6 |
9 |
Middle East and North Africa |
| Mauritius |
73.0 |
25 |
Sub-Saharan Africa |
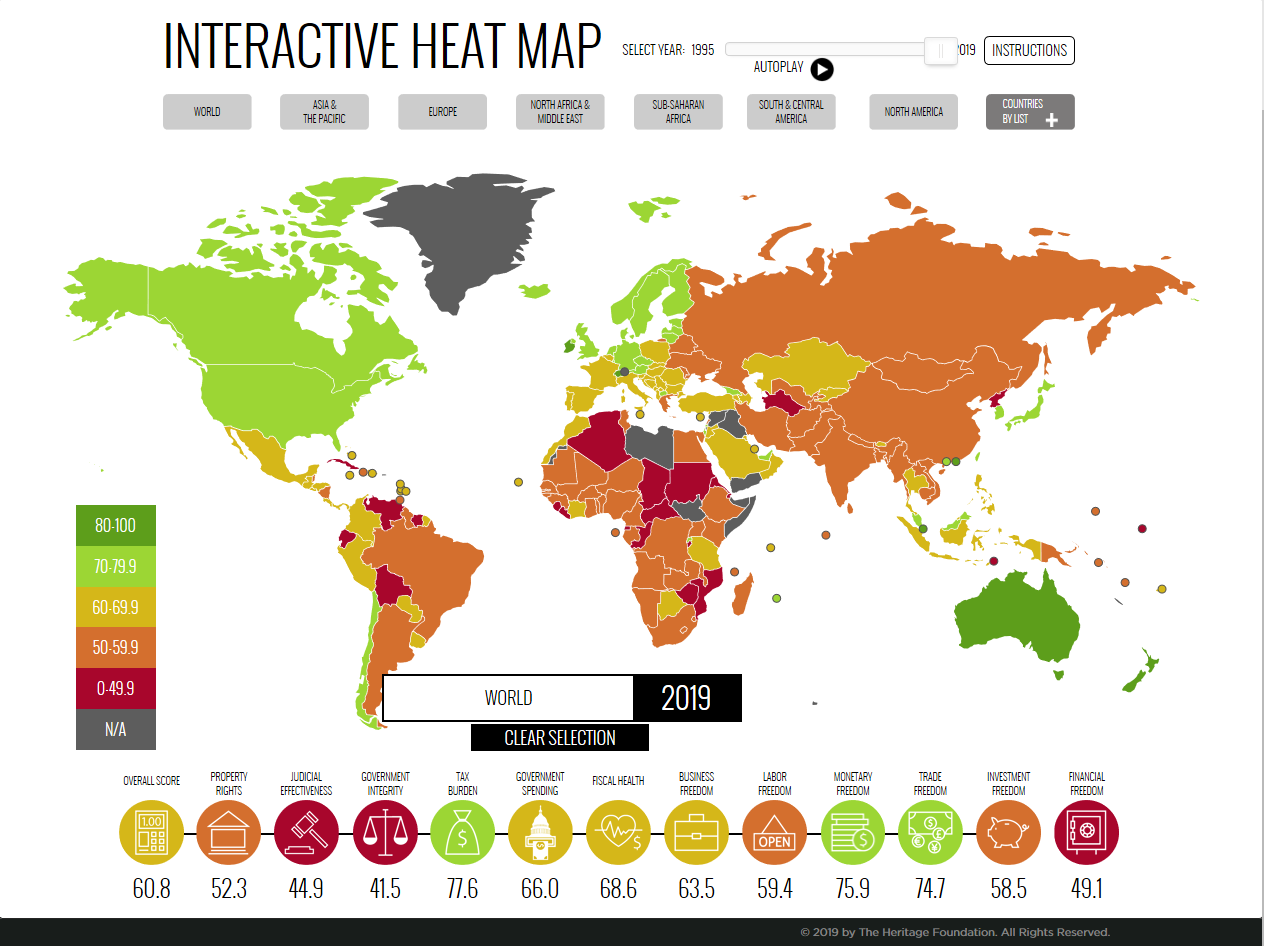
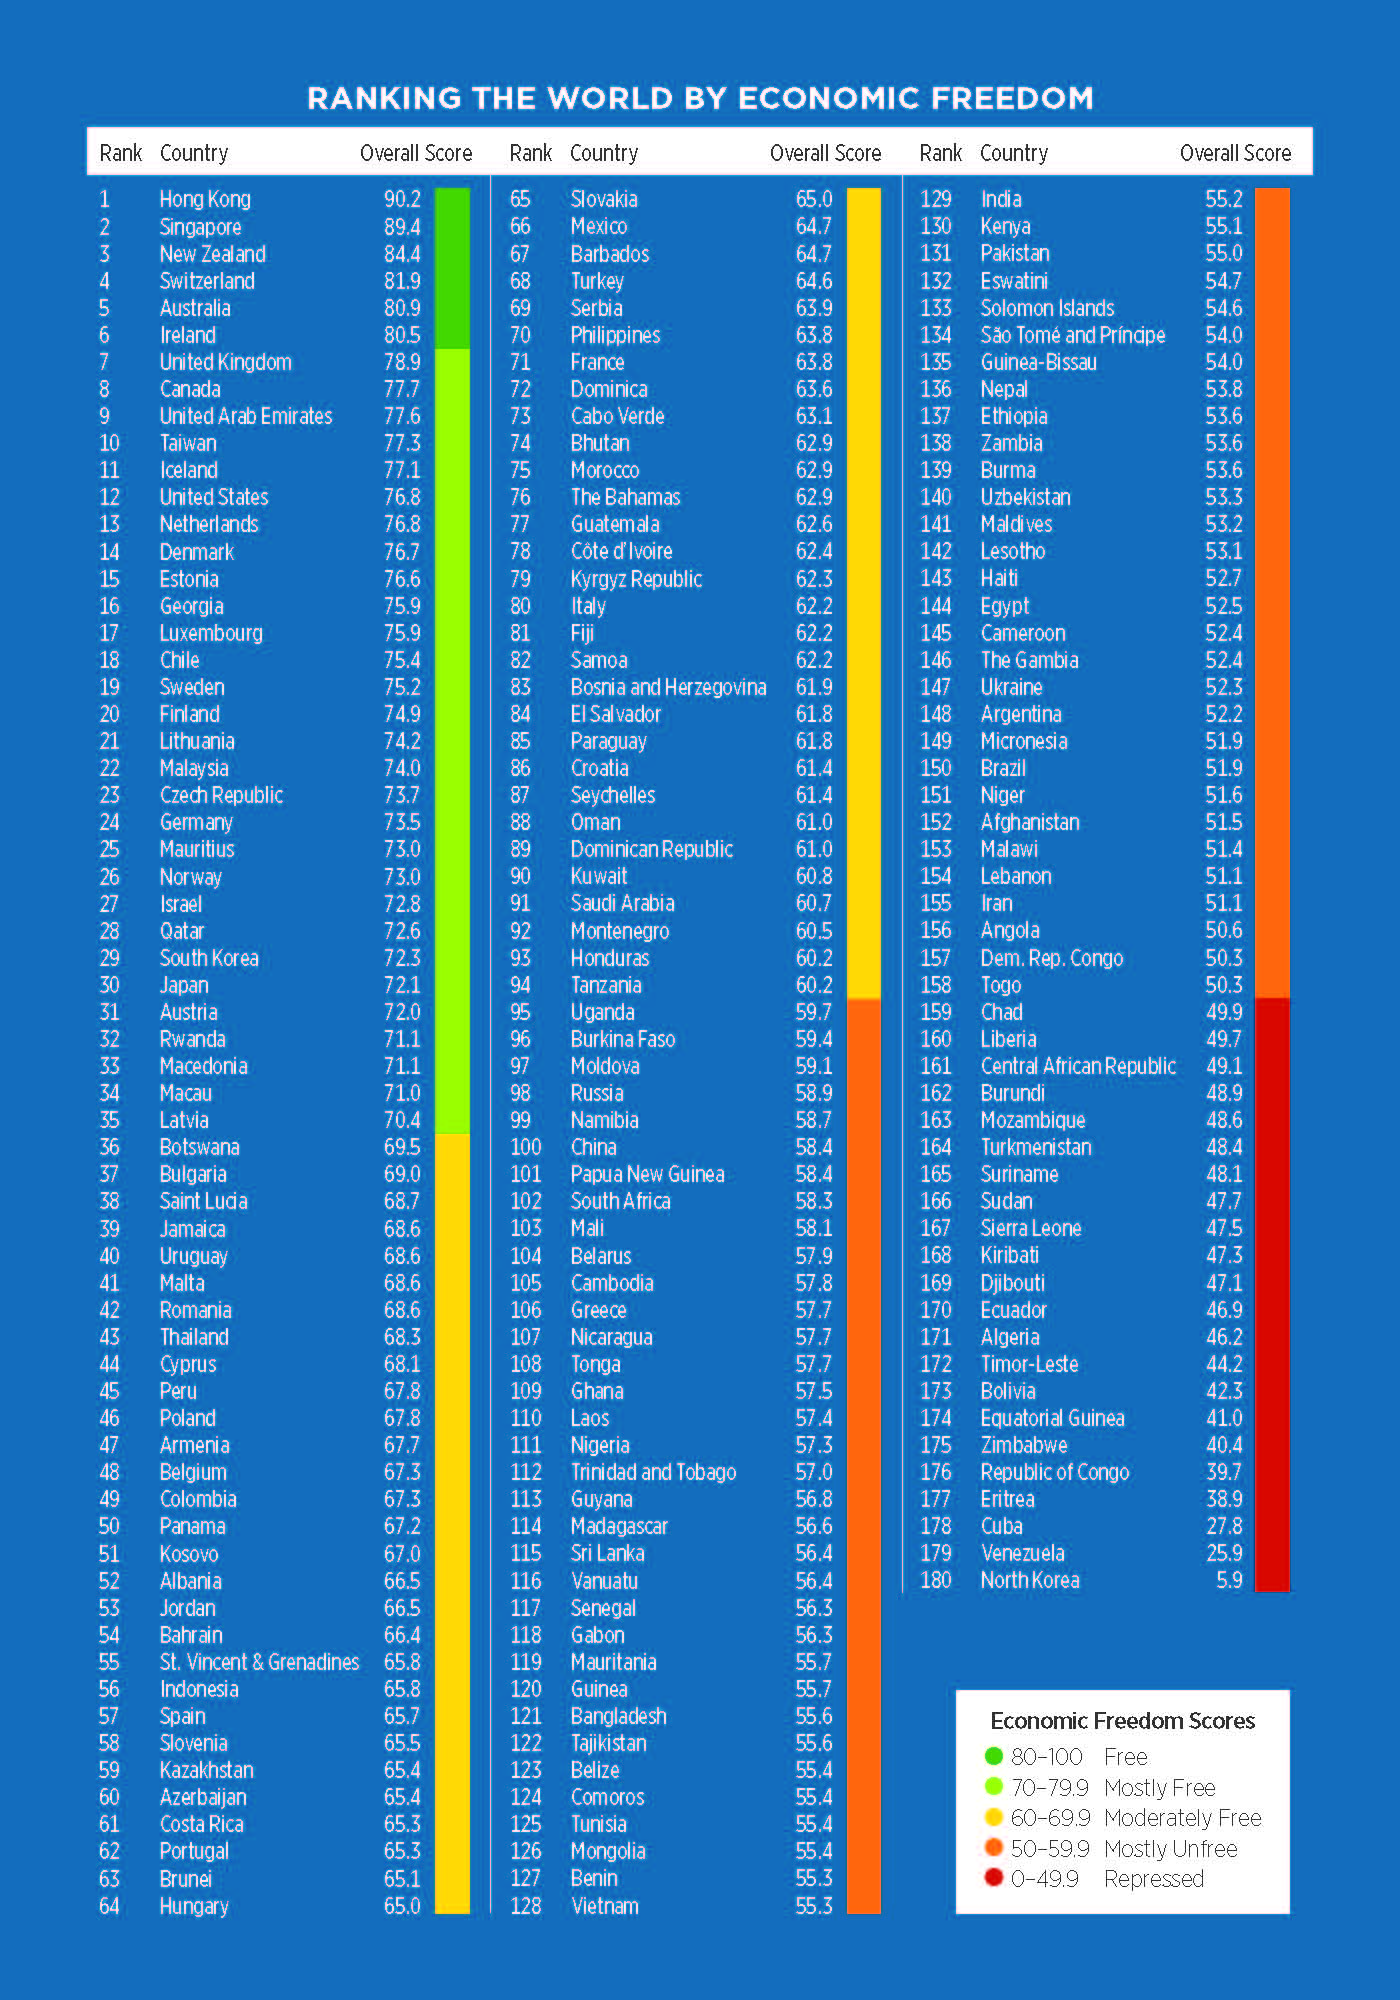
2019 Index of Economic Freedom | Interactive Graphical Data by DrasticData
Interactive Tabular Data by DataTables
Global Rankings on Economic Freedom:
| ID |
Country ID |
Country Name |
2019 Country Economic Freedom Score |
2019 Country Rank |
Region Name |
2019 Region Rank |
M01. Property Rights |
M02. Judical Effectiveness |
M03. Government Integrity |
M04. Tax Burden |
M05. Government Spending |
M06. Fiscal Health |
M07. Business Freedom |
M08. Labor Freedom |
M09. Monetary Freedom |
M10. Trade Freedom |
M11. Investment Freedom |
M12. Financial Freedom |
F01: Tariff Rate (%) |
F02: Income Tax Rate (%) |
F03: Corporate Tax Rate (%) |
F04: Tax Burden % of GDP |
F05: Government Expenditure % of GDP |
F06: Population (Millions) |
F07: GDP (Billions, PPP) |
F08: GDP Growth Rate (%) |
F09: 5 Year GDP Growth Rate (%) |
F10: GDP per Capita (PPP) |
F11: Unemployment (%) |
F12: Inflation (%) |
F13: FDI Inflow (Millions) |
F14: Public Debt (% of GDP) |
Watch (Where Does the U.S. Rank in World Economic Freedom?)
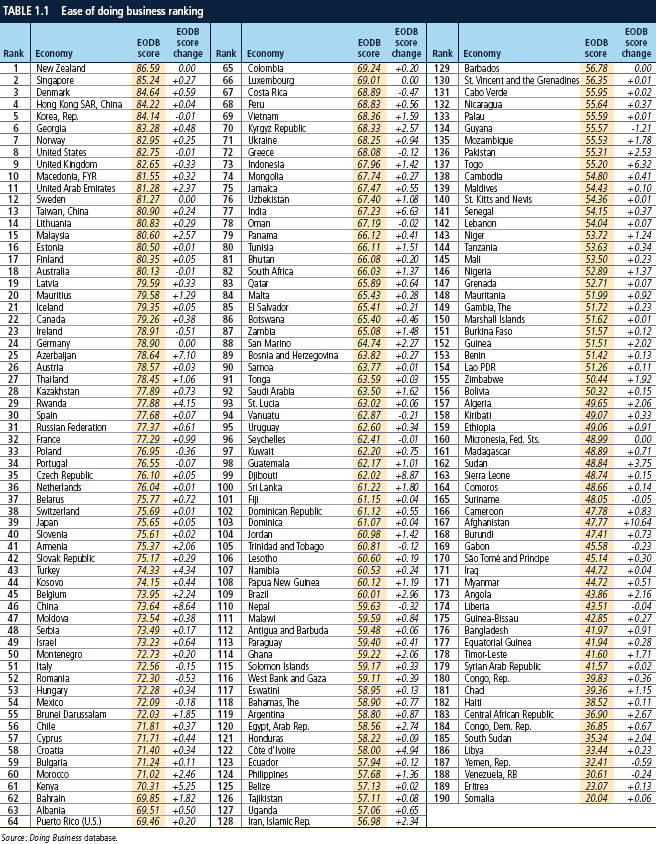
Global Ranking 2 of 4. World Ease of Doing Business as of 2019
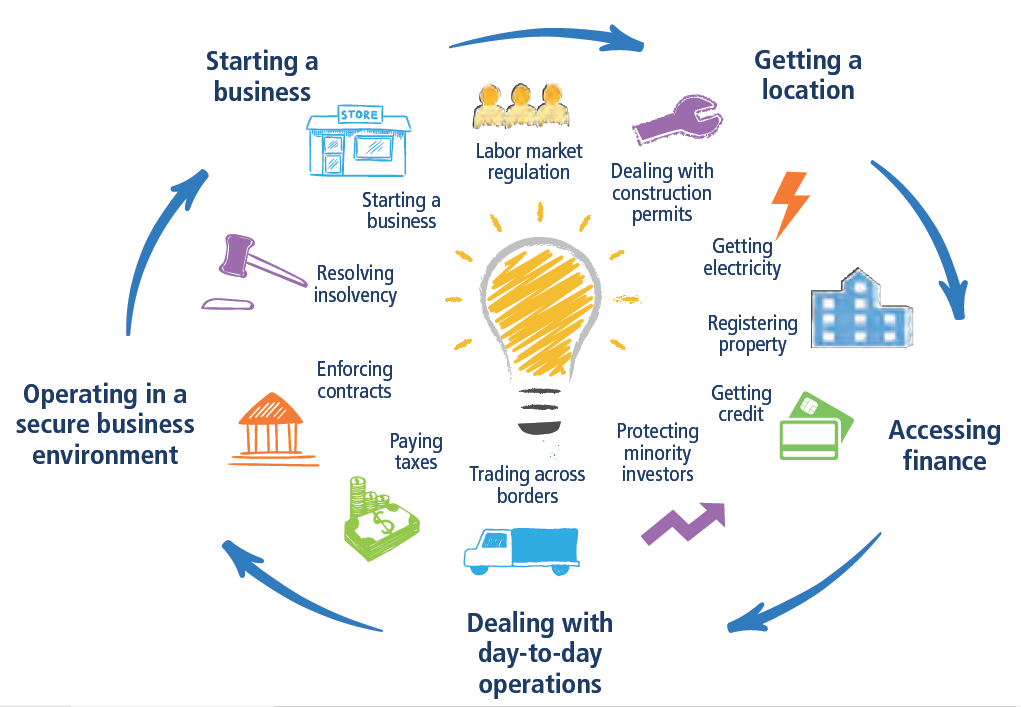
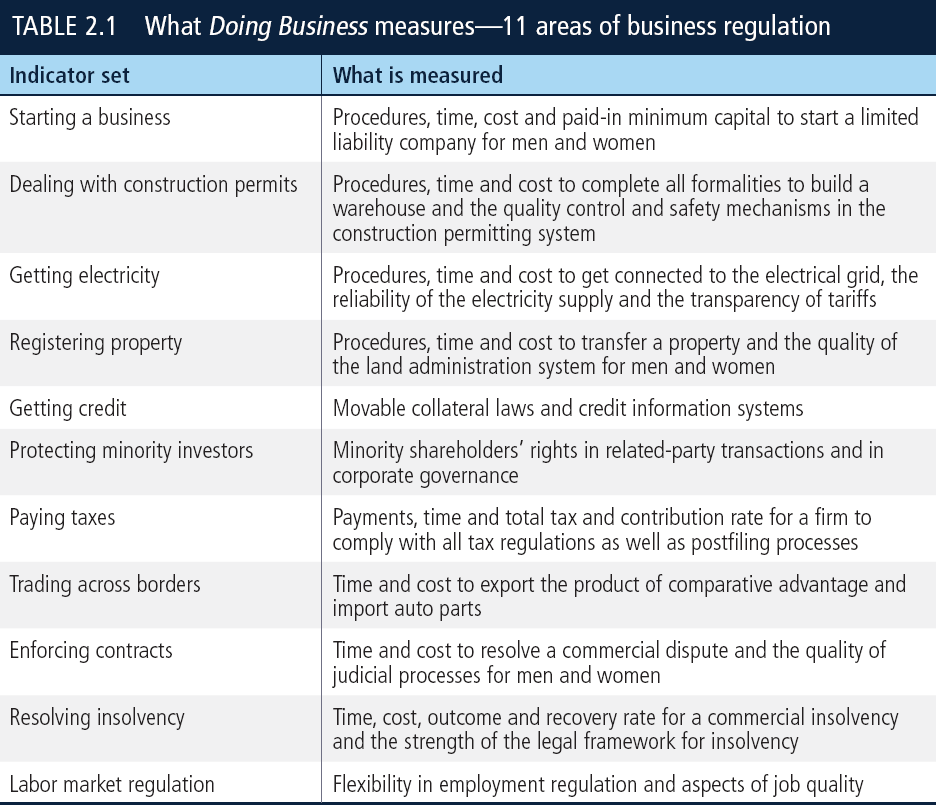
In addition to the Heritage Foundation's Index of Economic Freedom and also from a somewhat different perspective, in 2019, the World Bank Group released the 16th edition of its Doing Business index. The World Bank Group utilized the following 10 measures to gauge the degree of ease it is to do business in a given country:
- starting a business or business incorporation
- dealing with construction permits
- getting electricity
- registering property
- getting credit
- protecting minority investors
- trading across borders
- paying taxes
- enforcing contracts
- resolving insolvency
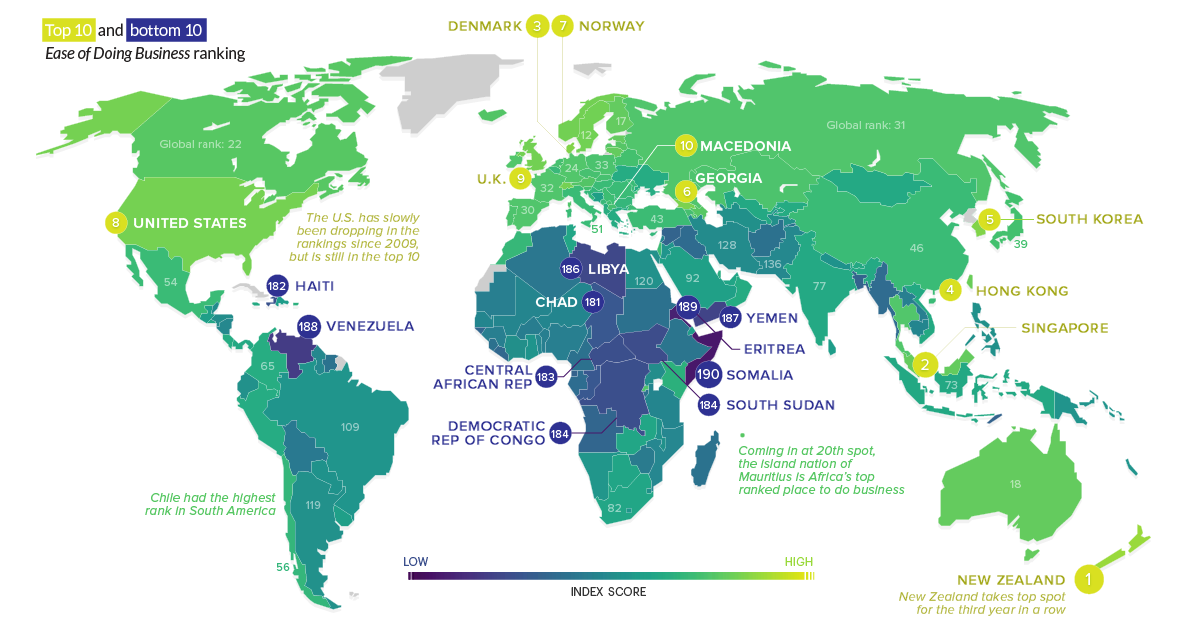
The graphics below provide a visual synopsis of the Doing Business index. Suffice it to say New Zealand scored the highest as the country where it is easiest to do business, and, of the countries surveyed, Somalia scored the lowest.
 Watch (World Bank kills 'Doing Business' report after probe concludes pressure on rankings)
Global Ranking 3 of 4. 2018 Global Innovation Index
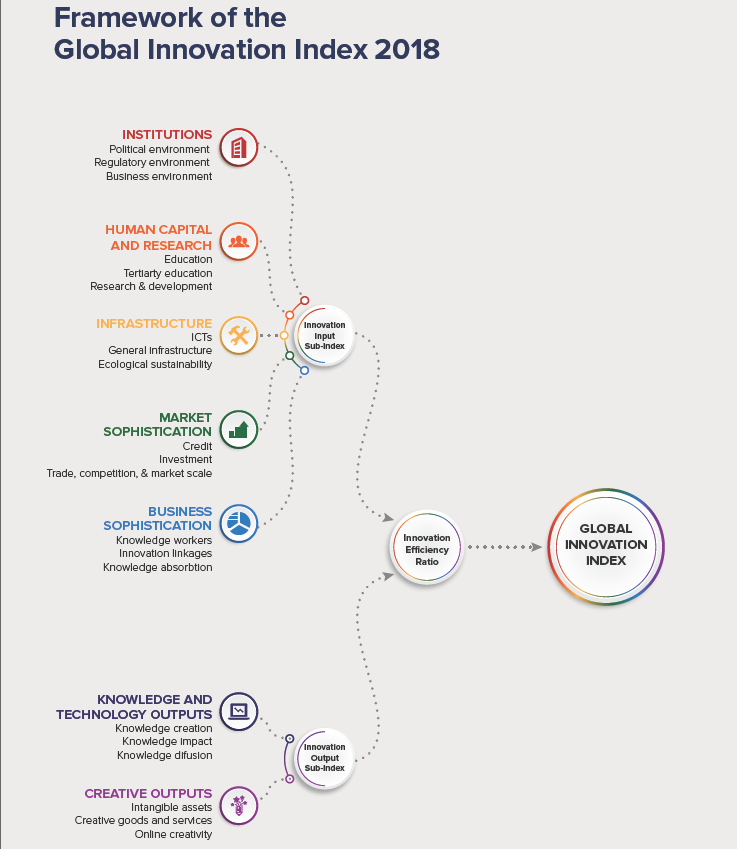
From the perspective of business innovation, in 2018, the 11th edition was released of the Global Innovation Index (GII). The Global Innovation Index is co-published by Cornell University, INSEAD, and the World Intellectual Property Organization (WIPO). The Global Innovation Index is comprised of four main measures and a series of sub-measures as depicted in the graphic immediately below:
- The overall GII score
- The Innovation Input Sub-Index
- The Innovation Output Sub-Index
- The Innovation Efficiency Ratio
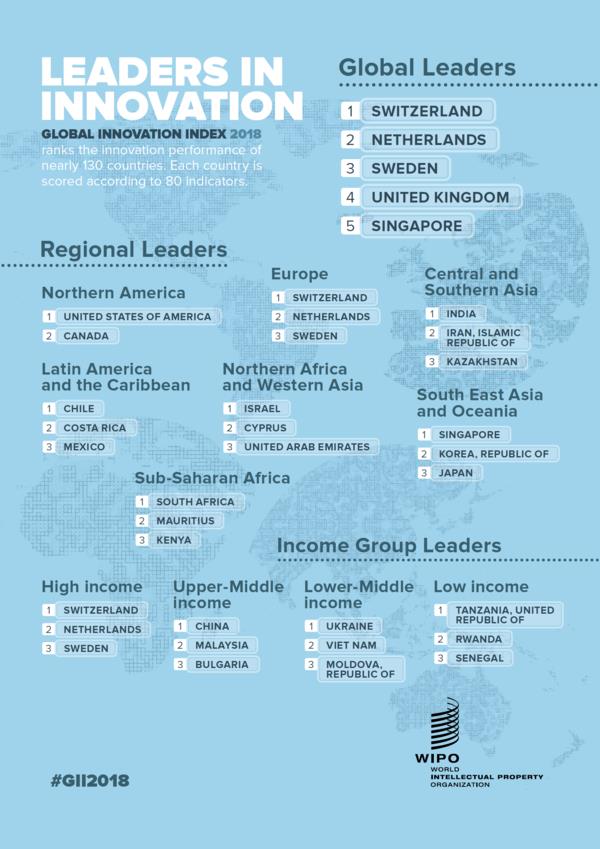
The next table and graphic provide a visual synopsis of the 2018 Global Innovation Index. In its 2018 edition, Switzerland [once again] achieved the honor of being named as the country with the most innovative business climate on Earth. Of the countries surveyed, Yemen was deemed as having a business sector that was least conducive to business innovation.
2018 Global Innovation Index
| Country |
Rank |
Score |
Country |
Rank |
Score |
Country |
Rank |
Score |
| Switzerland |
1 |
68.4 |
Ukraine |
43 |
38.5 |
Indonesia |
85 |
29.8 |
| Netherlands |
2 |
63.3 |
Thailand |
44 |
38 |
Belarus |
86 |
29.4 |
| Sweden |
3 |
63.1 |
Viet Nam |
45 |
37.9 |
Dominican Republic |
87 |
29.3 |
| United Kingdom |
4 |
60.1 |
Russian Federation |
46 |
37.9 |
Sri Lanka |
88 |
28.7 |
| Singapore |
5 |
59.8 |
Chile |
47 |
37.8 |
Paraguay |
89 |
28.7 |
| United States of America |
6 |
59.8 |
Moldova, Republic of |
48 |
37.6 |
Lebanon |
90 |
28.2 |
| Finland |
7 |
59.6 |
Romania |
49 |
37.6 |
Botswana |
91 |
28.2 |
| Denmark |
8 |
58.4 |
Turkey |
50 |
37.4 |
Tanzania, United Republic of |
92 |
28.1 |
| Germany |
9 |
58 |
Qatar |
51 |
36.6 |
Namibia |
93 |
28 |
| Ireland |
10 |
57.2 |
Montenegro |
52 |
36.5 |
Kyrgyzstan |
94 |
27.6 |
| Israel |
11 |
56.8 |
Mongolia |
53 |
35.9 |
Egypt |
95 |
27.2 |
| Korea, Republic of |
12 |
56.6 |
Costa Rica |
54 |
35.7 |
Trinidad and Tobago |
96 |
27 |
| Japan |
13 |
55 |
Serbia |
55 |
35.5 |
Ecuador |
97 |
26.8 |
| Hong Kong (China) |
14 |
54.6 |
Mexico |
56 |
35.3 |
Cambodia |
98 |
26.7 |
| Luxembourg |
15 |
54.5 |
India |
57 |
35.2 |
Rwanda |
99 |
26.5 |
| France |
16 |
54.4 |
South Africa |
58 |
35.1 |
Senegal |
100 |
26.5 |
| China |
17 |
53.1 |
Georgia |
59 |
35 |
Tajikistan |
101 |
26.5 |
| Canada |
18 |
53 |
Kuwait |
60 |
34.4 |
Guatemala |
102 |
25.5 |
| Norway |
19 |
52.6 |
Saudi Arabia |
61 |
34.3 |
Uganda |
103 |
25.3 |
| Australia |
20 |
52 |
Uruguay |
62 |
34.2 |
El Salvador |
104 |
25.1 |
| Austria |
21 |
51.3 |
Colombia |
63 |
33.8 |
Honduras |
105 |
24.9 |
| New Zealand |
22 |
51.3 |
Brazil |
64 |
33.4 |
Madagascar |
106 |
24.8 |
| Iceland |
23 |
51.2 |
Iran, Islamic Republic of |
65 |
33.4 |
Ghana |
107 |
24.5 |
| Estonia |
24 |
50.5 |
Tunisia |
66 |
32.9 |
Nepal |
108 |
24.2 |
| Belgium |
25 |
50.5 |
Brunei Darussalam |
67 |
32.8 |
Pakistan |
109 |
24.1 |
| Malta |
26 |
50.3 |
Armenia |
68 |
32.8 |
Algeria |
110 |
23.9 |
| Czech Republic |
27 |
48.7 |
Oman |
69 |
32.8 |
Cameroon |
111 |
23.8 |
| Spain |
28 |
48.7 |
Panama |
70 |
32.4 |
Mali |
112 |
23.3 |
| Cyprus |
29 |
47.8 |
Peru |
71 |
31.8 |
Zimbabwe |
113 |
23.1 |
| Slovenia |
30 |
46.9 |
Bahrain |
72 |
31.7 |
Malawi |
114 |
23.1 |
| Italy |
31 |
46.3 |
Philippines |
73 |
31.6 |
Mozambique |
115 |
23.1 |
| Portugal |
32 |
45.7 |
Kazakhstan |
74 |
31.4 |
Bangladesh |
116 |
23.1 |
| Hungary |
33 |
44.9 |
Mauritius |
75 |
31.3 |
Bolivia, Plurinational State of |
117 |
22.9 |
| Latvia |
34 |
43.2 |
Morocco |
76 |
31.1 |
Nigeria |
118 |
22.4 |
| Malaysia |
35 |
43 |
Bosnia and Herzegovina |
77 |
31.1 |
Guinea |
119 |
20.7 |
| Slovakia |
36 |
42.9 |
Kenya |
78 |
31.1 |
Zambia |
120 |
20.7 |
| Bulgaria |
37 |
42.6 |
Jordan |
79 |
30.8 |
Benin |
121 |
20.6 |
| United Arab Emirates |
38 |
42.6 |
Argentina |
80 |
30.7 |
Niger |
122 |
20.6 |
| Poland |
39 |
41.7 |
Jamaica |
81 |
30.4 |
Cote d'Ivoire |
123 |
20 |
| Lithuania |
40 |
41.2 |
Azerbaijan |
82 |
30.2 |
Burkina Faso |
124 |
18.9 |
| Croatia |
41 |
40.7 |
Albania |
83 |
30 |
Togo |
125 |
18.9 |
| Greece |
42 |
38.9 |
TFYR Macedonia |
84 |
29.9 |
Yemen |
126 |
15 |
 Watch (Global Innovation Index 2018: What's It All About?)
Global Ranking 4 of 4. Corruption Perceptions Index 2018
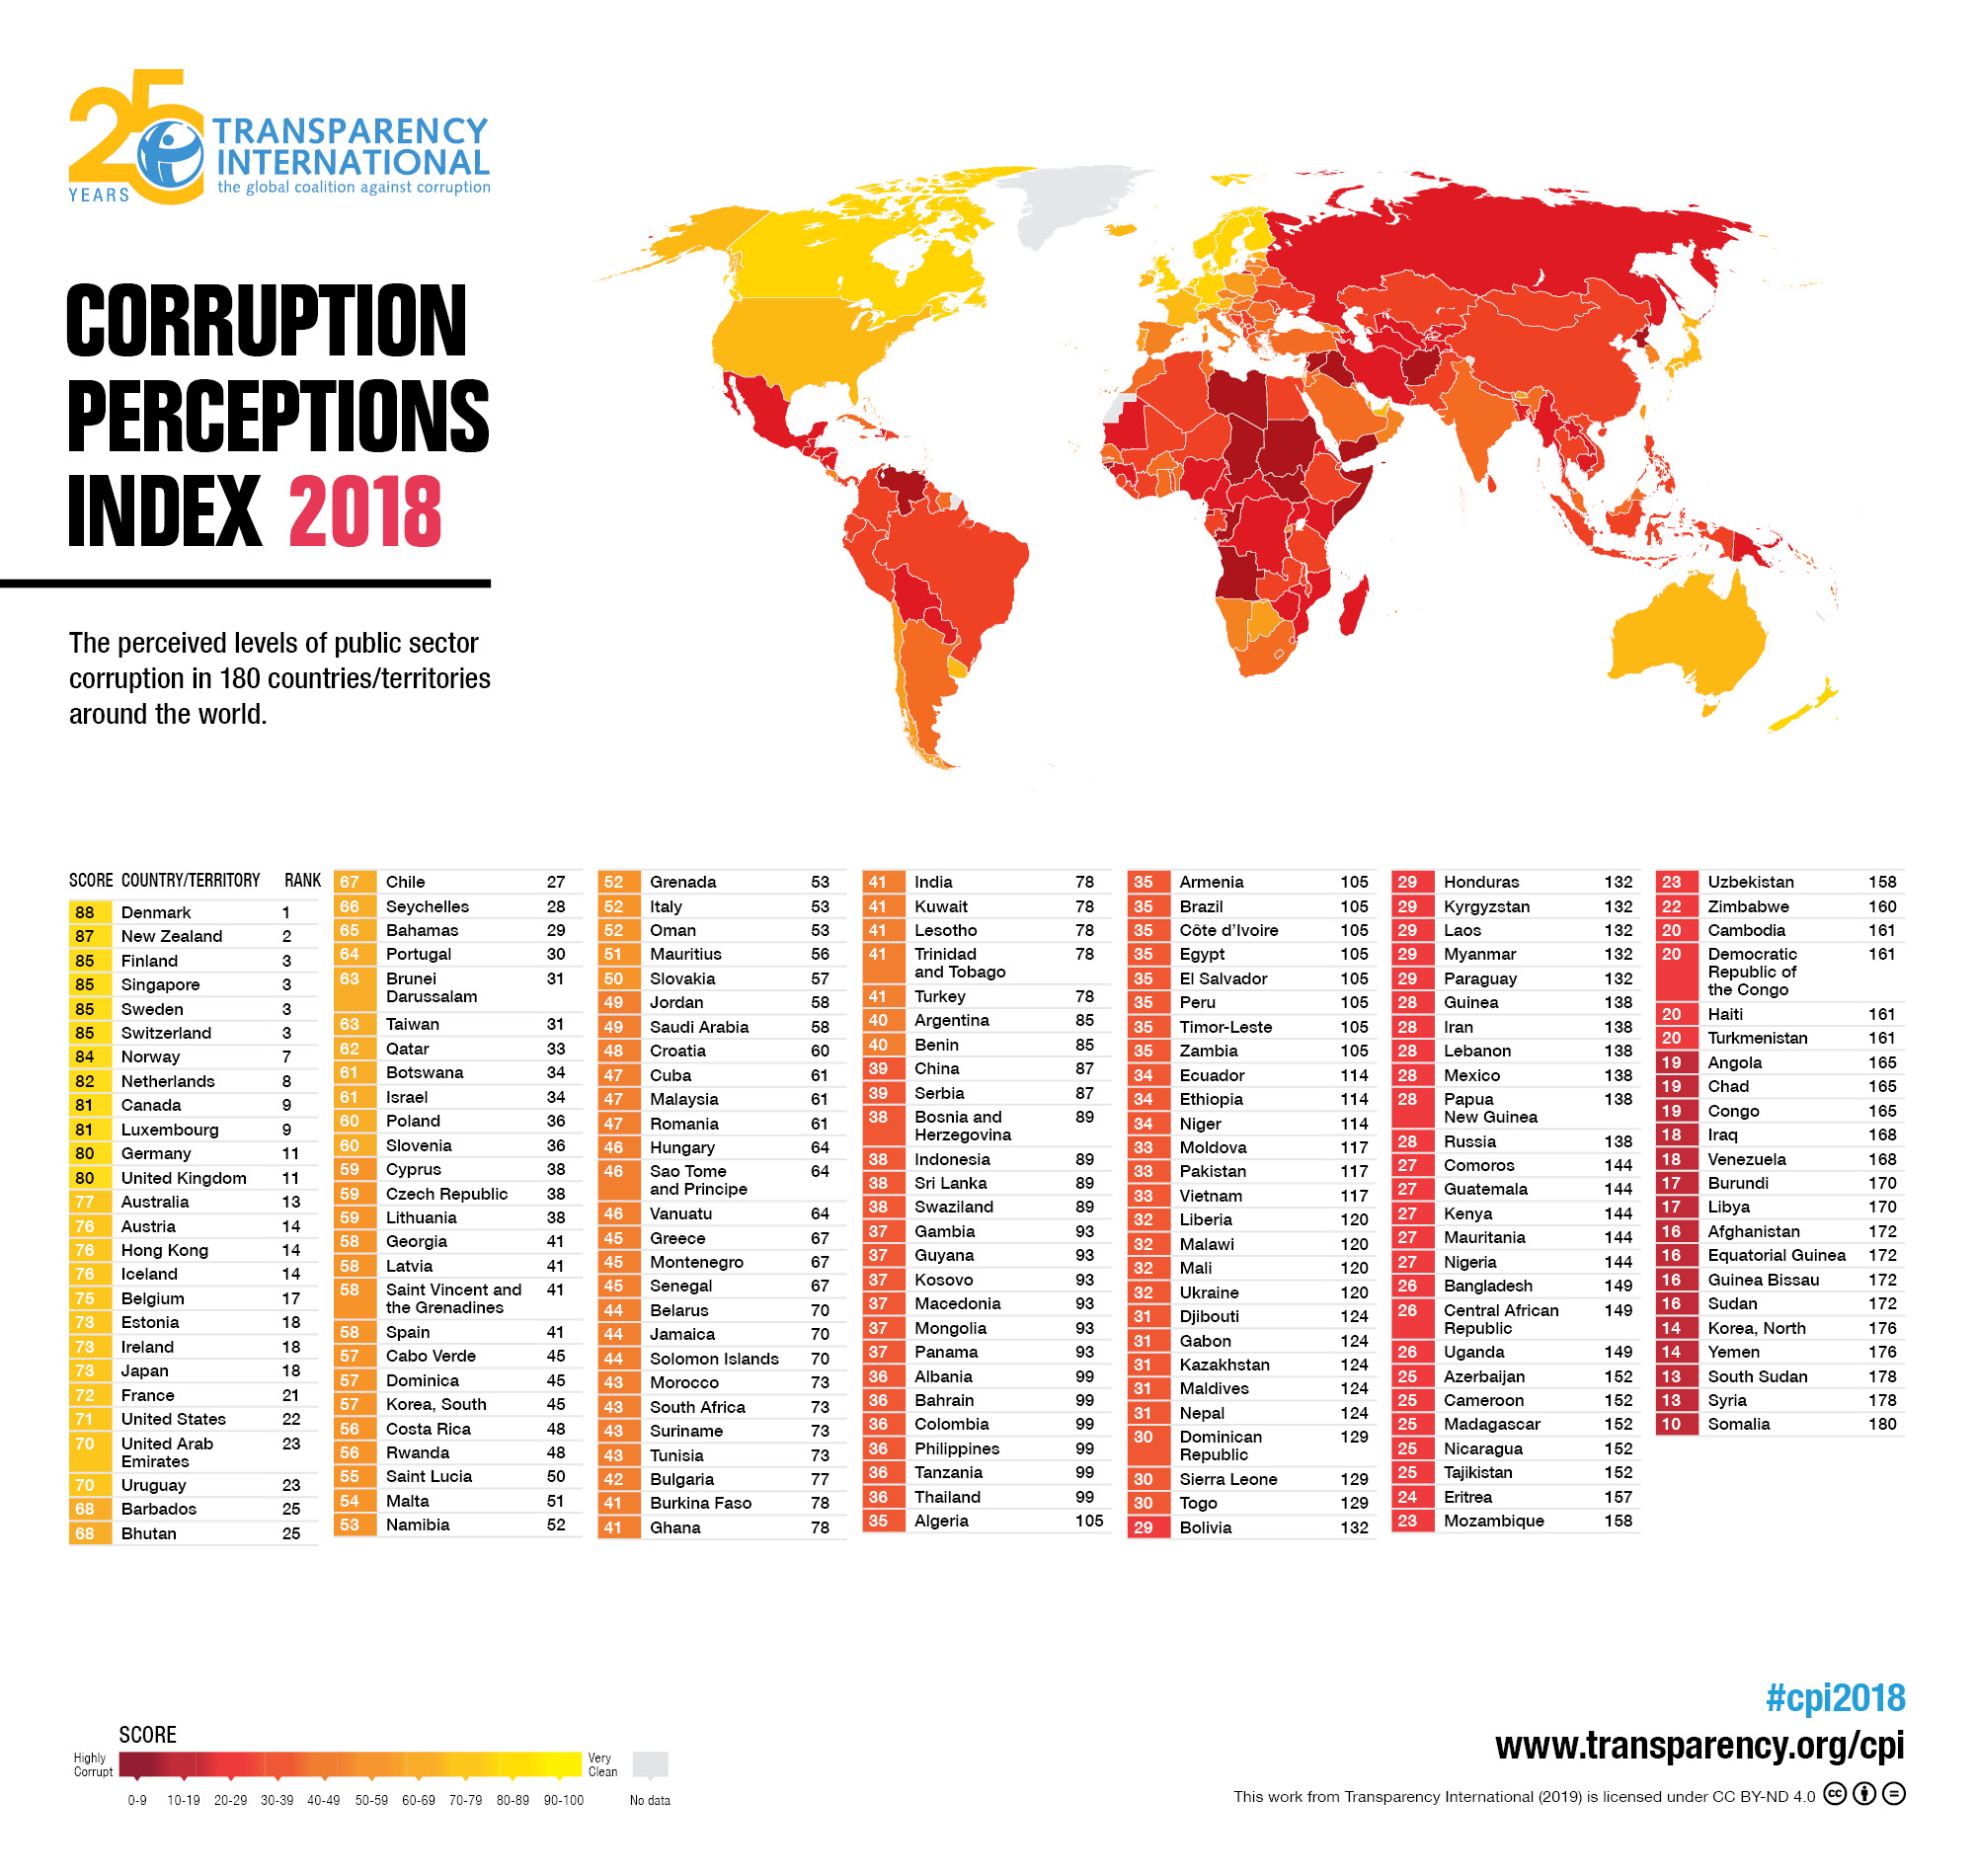
Finally, from the perspective of corruption, in 2019, Transparency International published the 24th edition of its Corruption Perceptions Index. This particular index focuses on the "perception" of corruption in a given country's public sector. It does not measure actual incidences of corruption. Transparency International broadly defines corruption as "the abuse of entrusted power for private gain."
Although the Corruption Perceptions Index focuses on perceptions of corruption in the public or government sector of society, cheating and corruption also exist in the private or business sector of these same countries. Moreover, where there exists rampant corruption in the public sector, said corruption can spillover into the private sector and adversely impact how the private sector operates. As humans prepare for 22nd century living, they must strive to eliminate corruption in all its forms from all sectors of civil society. Not only does corruption undermine the rule of law and distort the functioning of free institutions in a country's political sphere but also said corruption distorts the efficient functioning of free markets in a country's economic sphere. Corruption is the polar opposite of honesty and transparency. Corruption undermines the general faith and trust of citizens in the integrity of societal institutions.
The next graphic provides a visual synopsis of the Corruption Perceptions Index for 2018. Using a scoring scale of 0 (meaning "highly
corrupt") to 100 (meaning "very clean"), in its 2018 edition of the index, Denmark achieved the honor of being named as the least (politically) corrupt country on Earth with an overall score of 88. Of the countries surveyed, Somalia was deemed as being the most (politically) corrupt country on Earth with an overall score of 10. Transparency International further noted that "more than two-thirds of countries score below 50, while the average score is just 43." Perhaps most disturbing is that the vast majority of countries assessed have made little to no progress in taking concrete steps to reduce perceived levels of corruption.
 Watch (Corruption Perceptions Index Explained | Transparency International)
Several related global quality-of-life rankings worth noting include the following ones:
- Human Development Index (HDI)
- Social Progress Index
- Freedom in the World
- Vision of Humanity
- Global Passport Power Rank
- RSF's World Press Freedom Index
- World Happiness Report
- World Justice Project
- United States Commission on International Religious Freedom
Scroll up
